Call Center KPI:
A call center is one of the most important tools for customer acquisition, maintaining good customer relationships, improving after-sales service and maximizing customer lifetime value through reselling, side selling and upselling. In this article, we’ll be sharing with you the Top Call Center KPI (Key Performance Indicators) for maximizing business growth and profitability through the efficient use of a call center software.
Peak inbound call time

What it is:
The time/s when your team is receiving the most inbound calls.
Why it’s important:
Like the Average Waiting Time metric, this will help you distribute your team for optimal call load handling.
How to use it:
This metric is easy enough to understand. Your system should issue a report with the number of calls per time period. With it, you can calculate how many agents are required to handle that call volume while maintaining the desired average waiting time and average call duration (see below).
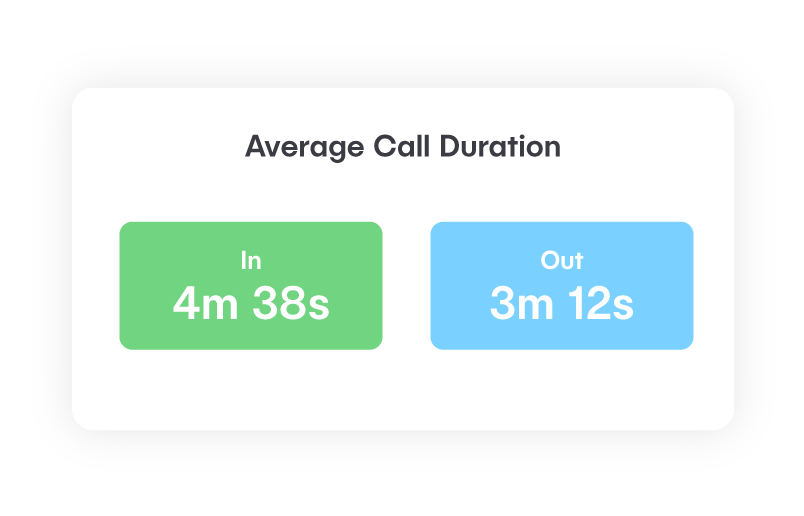
Average call duration

What it is:
For Inbound:
The duration of a call, from the moment the agent picks up till the time the call is concluded.
For Outbound:
The duration of a call, from the moment the recipient picks up till the time the call is concluded.
Why it’s important:
For Inbound:
Together with the First Call Resolution KPI (see earlier), this metric helps you understand how efficient your agents are at resolving caller issues in a timely manner. Shorter calls mean that your agents can handle a larger volume of calls and service more callers.
For Outbound:
Together with the Conversion Rate KPI (see later), this metric helps you determine how the sales process is performing. Based on the length of the call, you can start to identify where the sales process is failing/succeeding, and give you insights into how to improve it.
How to use it:
While this Call Center KPI is helpful in a quantitative way, it requires a qualitative context to help you extrapolate your action steps. Typically, you’ll want to combine it with a call recording feature (ideally with auto-transcription).
For Inbound:
With this metric, you should break up your call durations into different cohorts, then use a sample of the recordings from each cohort to identify key elements in those calls. Typically, you’ll want to answer the following questions:
- Why was the call so short/long?
- Were the specific sticking points? What caused them? E.g. Was it a lack of preparation on the agent’s side? Was it due to a poor onboarding process?
- What are the steps that you can take to optimize the calls and make them shorter? For instance, if you notice that a particular agent has developed an efficient and satisfactory method for quick resolution, you could adopt this into your next team training. Or you might notice that a particular issue keeps coming up, and that it could easily be handled through the use of a dedicated help page.
For Outbound:
With this metric, you should break up your call durations into different cohorts, then use a sample of the recordings from each cohort to identify key elements in those calls. Typically, you’ll want to answer the following questions:
- Why was the call so short/long?
- Were the specific objections? What caused them?
- What are the steps that you can take to optimize the sales process? For instance, if you notice that a particular agent has developed an efficient and satisfactory method for closing sales, this should be shared with the rest of the team.
Calls answered/abandoned Ratio

What it is:
This metric gives you the ratio between calls that have been answered, and calls that have been abandoned i.e. where the caller decides to drop the call because they’ve had enough of waiting.
Why it’s important:
There might be situations where your agents are unable to handle the number of incoming calls due to the excessive load, resulting in a sub-par answered/abandoned ratio. However, when this becomes a consistent thread, it is indicative of an underlying problem in the team’s operation.
An elevated number of abandoned calls may result in customer dissatisfaction, loss of revenue and even cancellations.
How to use it:
The number of abandoned calls should always be as low as possible. The occasional spike will still occur, but it should be kept in check and the cause should be studied and understood to avoid recurrence.
First Call Resolution (FCR)

What it is:
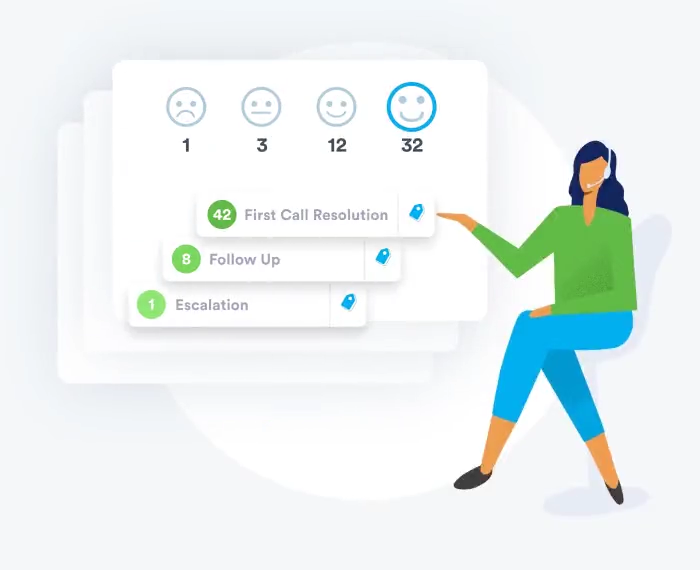
Cases solved in the very first call (no follow-up calls required). You can also track it as a percentage of all your customer service calls.
Why it’s important:
When issues are resolved within the first call, it’s a win-win for both customer and company. Customer satisfaction increases because of the fast resolution, while your agents will be able to service a larger number of customers.
How to use it:
- Keep regular records on the percentage of first call resolutions.
- If there is a negative variation, try to understand why.
Has a recent update made your product/service more complicated?
Is it always the same issues popping up
Have you recently acquired a number of new agents who might be less experienced and might need more training? - If there is a positive variation, also try to understand where it’s coming from.
Has your team recently received training that might have improved their performance?
Who are the top agents?
What are they doing, and how can the rest of the team learn from them? - Use NUACOM Call Tags to classify your calls and identify your First Call Resolution events in your call logs. You can even combine multiple tags and evaluate what issues are commonly being resolved on first contact.
Average waiting time

What it is:
The average time your callers spend on hold, from the moment they make the call to the moment an agent picks up.
Why it’s important:
This metric helps you identify the optimal ratio of agents vs calls. Having too many agents can prove to be a financial strain on the business. Having too few will result in customer dissatisfaction, the decline in sales and possible increased cancellations (because customers feel like they’re not getting the support they deserve).
How to use it:
The “sweet spot” for this metric varies depending on your business and vertical, as well as the expectations of your customers.
Service level

What it is:
Some businesses can simply use Service Level KPI as the ratio between Inbound Calls Answered and Abandoned Calls. But it is also used by call centers as the percentage of calls that the team can answer within an acceptable waiting time. The threshold is usually set by the company according to industry standards.
Here’s a practical example:
- The company determines that the acceptable waiting time is 15 seconds
- Records show that out of 50 calls received
- 45 callers were picked up in less than 15 seconds (which it the company-set threshold)
- 5 callers had to wait more than 15 seconds on the line before being picked up
- 45 is 90% of the total of 50
- This means that the team’s service level is 90%
Why it’s important:
Best practices dictate that calls should be picked up within the least possible amount of time to maintain optimal caller satisfaction.
How to use it:
This Call Center KPI helps you understand whether your agents are maintaining a satisfactory service level by replying to calls as soon as they connect.
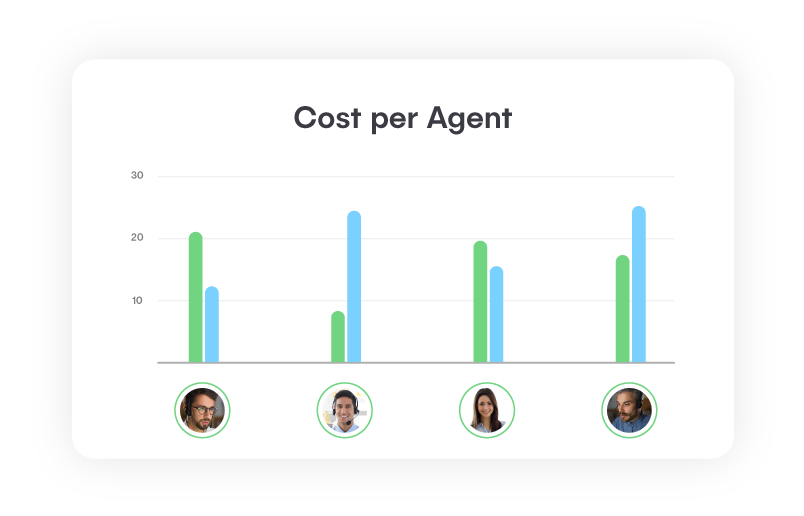
Cost per agent (only applicable for outbound calls)

What it is:
Allows you to determine the aggregate cost of all the calls made per agent.
Why it’s important:
The Cost per Agent KPI ties in closely to the Conversion Rate KPI. By calculating the operational cost of each agent and comparing it to their Conversion Rate, you can calculate their ROI and make decisions accordingly.
How to use this metric:
Cost per agent is calculated based on:
- Which country they’re calling (NUACOM offer free calling to a number of countries up to a certain volume, with the option to upgrade to more flexible plans)
- Whether the call is to a landline or mobile
For instance, NUACOM Essentials Plan gives you unlimited calls to landlines under the fair usage policy, which is a great way to get started.
This KPI calls for a number of considerations.
The most important thing to keep in mind is that you should never look at an agent’s cost KPI in isolation. Your most expensive agent might also be the one generating the most revenue. Then again, when comparing cost versus revenue, you might realise that the profit margin is unacceptably low.
The Cost Per Agent also factors into your cost-per-acquisition metric. Is it more profitable to target customers in Switzerland or Russia?
Conversion rate (mostly applicable to sales calls)

What it is:
How many of the phonecalls eventually convert into a sale.
Why it’s important:
Conversion rate helps you monitor the performance of your sales team, as well as make revenue predictions.
How to use it:
The Conversion Rate KPI isn’t something you’ll typically find in a call center solution. This is more within the realm of a CRM.
That said, when shopping around for a call center solution, it is preferable to find one that integrates natively with your CRM and other leading CRMs in the marketplace.
If you don’t have a CRM, it’s highly advisable that you acquire one. There are many popular CRMs out there, including ones that offer a flexible and free plan for start-ups and SMEs. One such example is Hubspot.
Once your call system is integrated with your CRM, you should be able to set up a tagging system that allows agents to tag successful sales calls with “Deal Won”. With this system, the sales manager can generate reports for the tag, and monitor sales over time.
Customer Call Frequency
![]()
What it is:
This metric allows you to monitor how frequently a specific customer calls in.
Why it’s important:
With the Customer Call Frequency KPI, you can see which of your customers are demanding the most attention, which in turn helps you work out their profitability.
How to use it:
There are multiple ways to use this metric.
You might decide to set a threshold based on your price point, where you determine that a client becomes unprofitable after a certain number of support calls. As a result, you could rework your pricing strategy where you offer X amount of free support calls, and charge for anything above that.
Conclusion
As the old saying goes, “if you can’t measure it, you can’t improve it”, and our experience at NUACOM has shown us that these are the top Call Center KPIs to keep in check.
NUACOM’s call center solution integrates with leading CRMs in the marketplace. You’ll be able to track all of the above-mentioned KPIs, as well as take advantage of a host of other features.
More importantly, NUACOM offers a “pay-as-you-grow” plan. This means you can start at a budget that you’re comfortable with, while still enjoying the functionality that will allow your business to grow at a steady and sustainable pace. And when it’s time to move to the next level, we’ll expand with you!
Bonus – 10 Other Call Center KPI You May Be Interested In:
- Talk Time
- Active Waiting Calls
- Dial per Hour
- Agent Utilization
- Call Volume
- Cost per Call
- Revenue per Successful Call
- Sales per Agent
- Customer Satisfaction
- Agent Schedule Adherence
If you’d like to implement all these Call Centers KPI in your business, talk to our sales team and arrange a customized demo.


